Contents · About 6 min read
📱 View as card news
When the smallest ballpark in MLB’s 30-team league also happens to be one of the most expensive to get into, something interesting is going on. I kept running into the name Fenway Sports Group (FSG) while researching Liverpool’s Anfield, and it turned out this same company also owns the Boston Red Sox and the NHL’s Pittsburgh Penguins — that overlap was reason enough to take a closer look at Boston too.
With two clubs under one roof, some comparisons came naturally, and I also noticed a marketing playbook quite different from what I’d seen at Liverpool.
Crowds and Tickets — the Smallest Park with the Priciest Seats
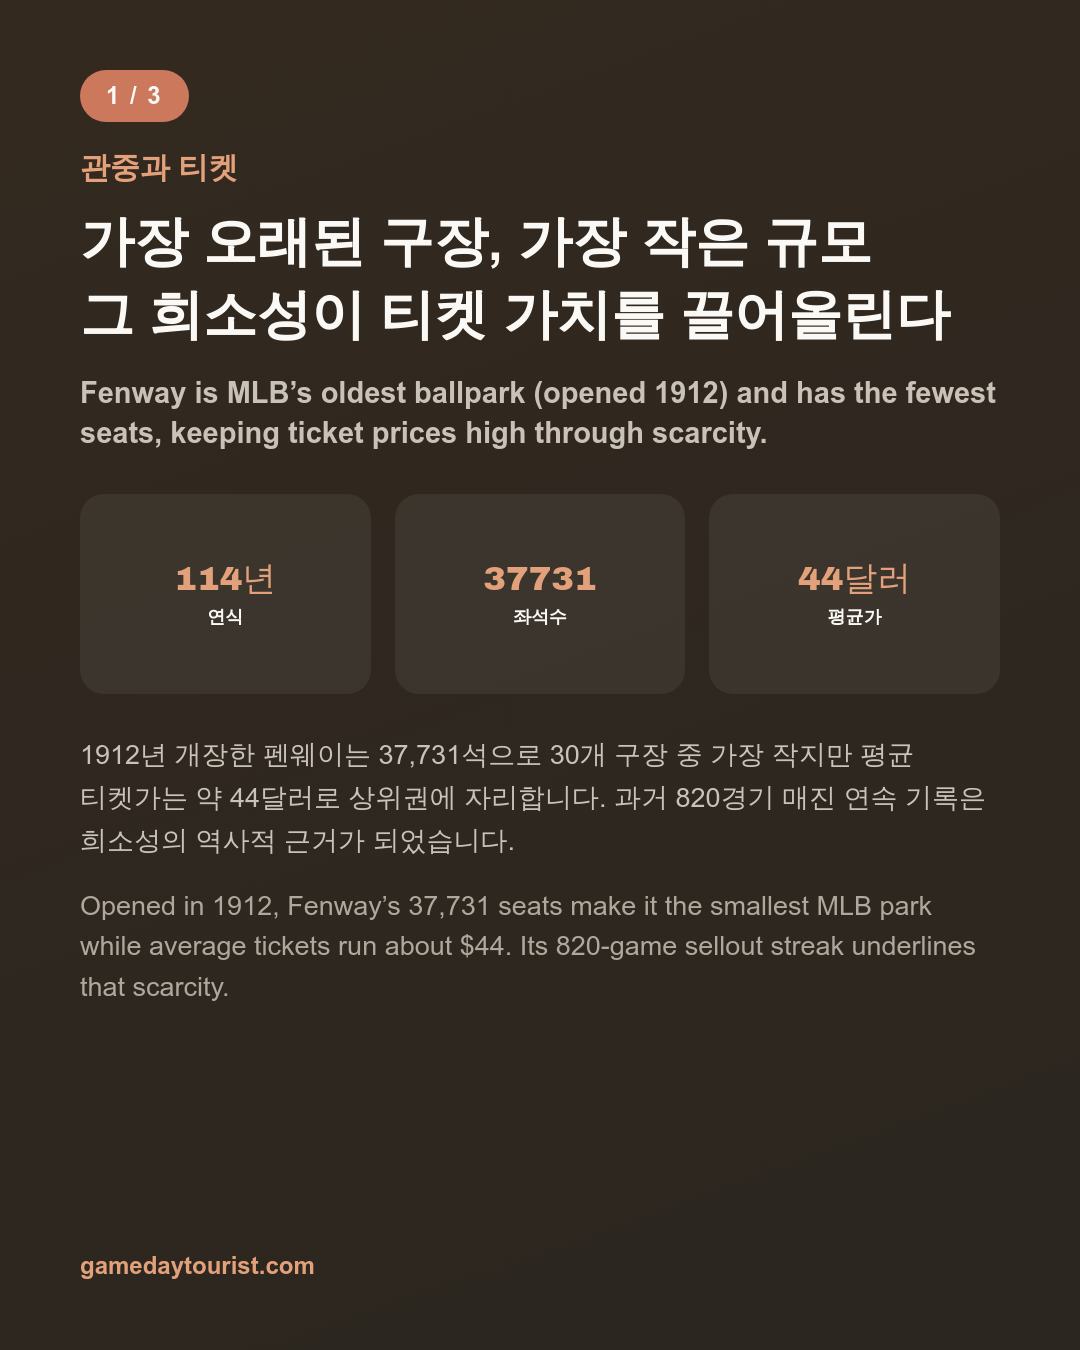
Fenway Park opened in 1912 and turns 114 this year, making it the oldest ballpark in MLB. Despite several renovations over the decades, its capacity has stayed at 37,731 — the smallest of any of the 30 teams.
And yet a 2026-season survey by online ticket-analysis outlets put the average ticket price at around $44, near the top of the league. It’s basic supply and demand at work: fewer seats mean less supply, and prices climb accordingly.
That scarcity has been proven historically, too. The Red Sox sold out 794 straight regular-season home games from May 2003 to April 2013 — 820 including the postseason — and contemporary news coverage called it the longest sellout streak in American pro sports history, with more than 30 million fans passing through Fenway’s gates over that decade.
Even now that the streak is over, that record still comes up constantly whenever the park’s ticket marketing is discussed.
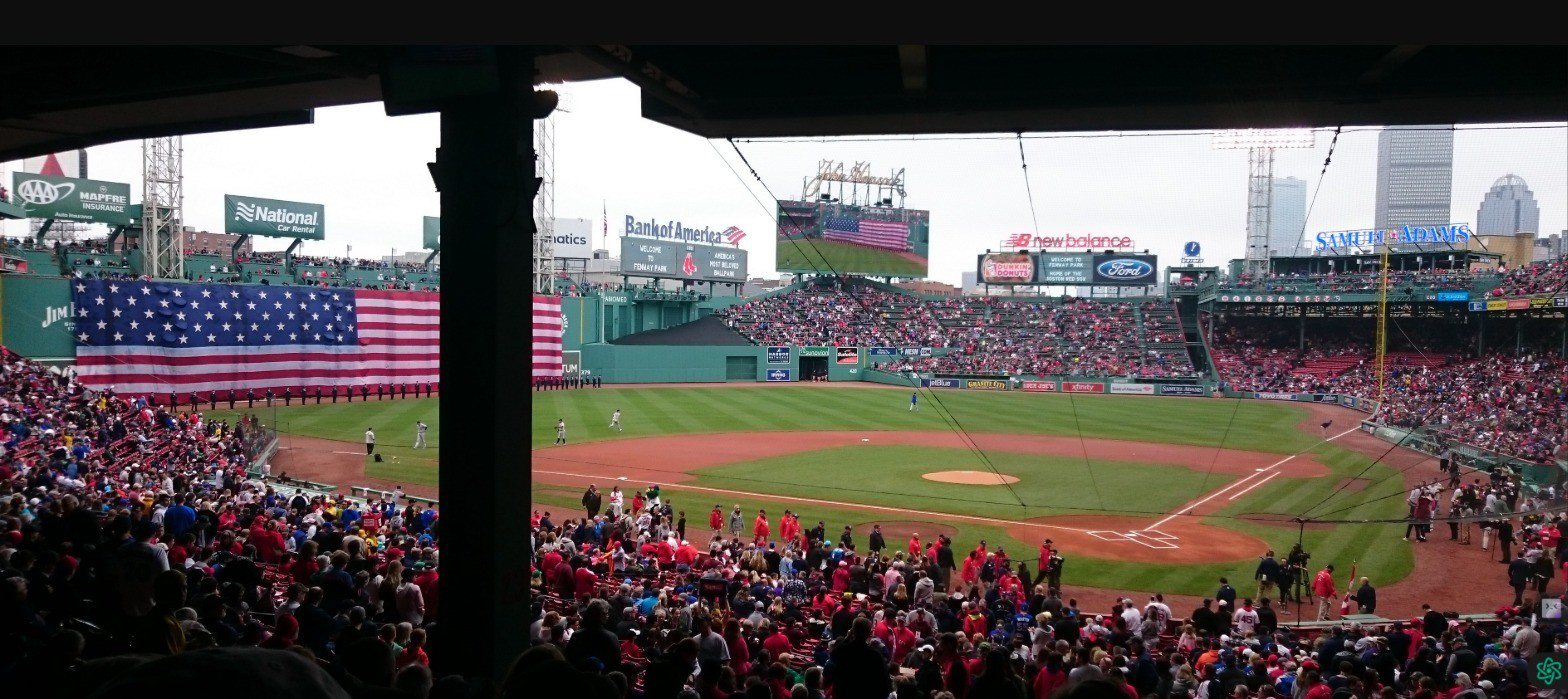
Pregame flag ceremony and the Green Monster seen from the stands at Fenway Park · Source: Wikimedia Commons (photo by Waz8, 2018), CC0 (public domain)
The Green Monster and Space Utilization
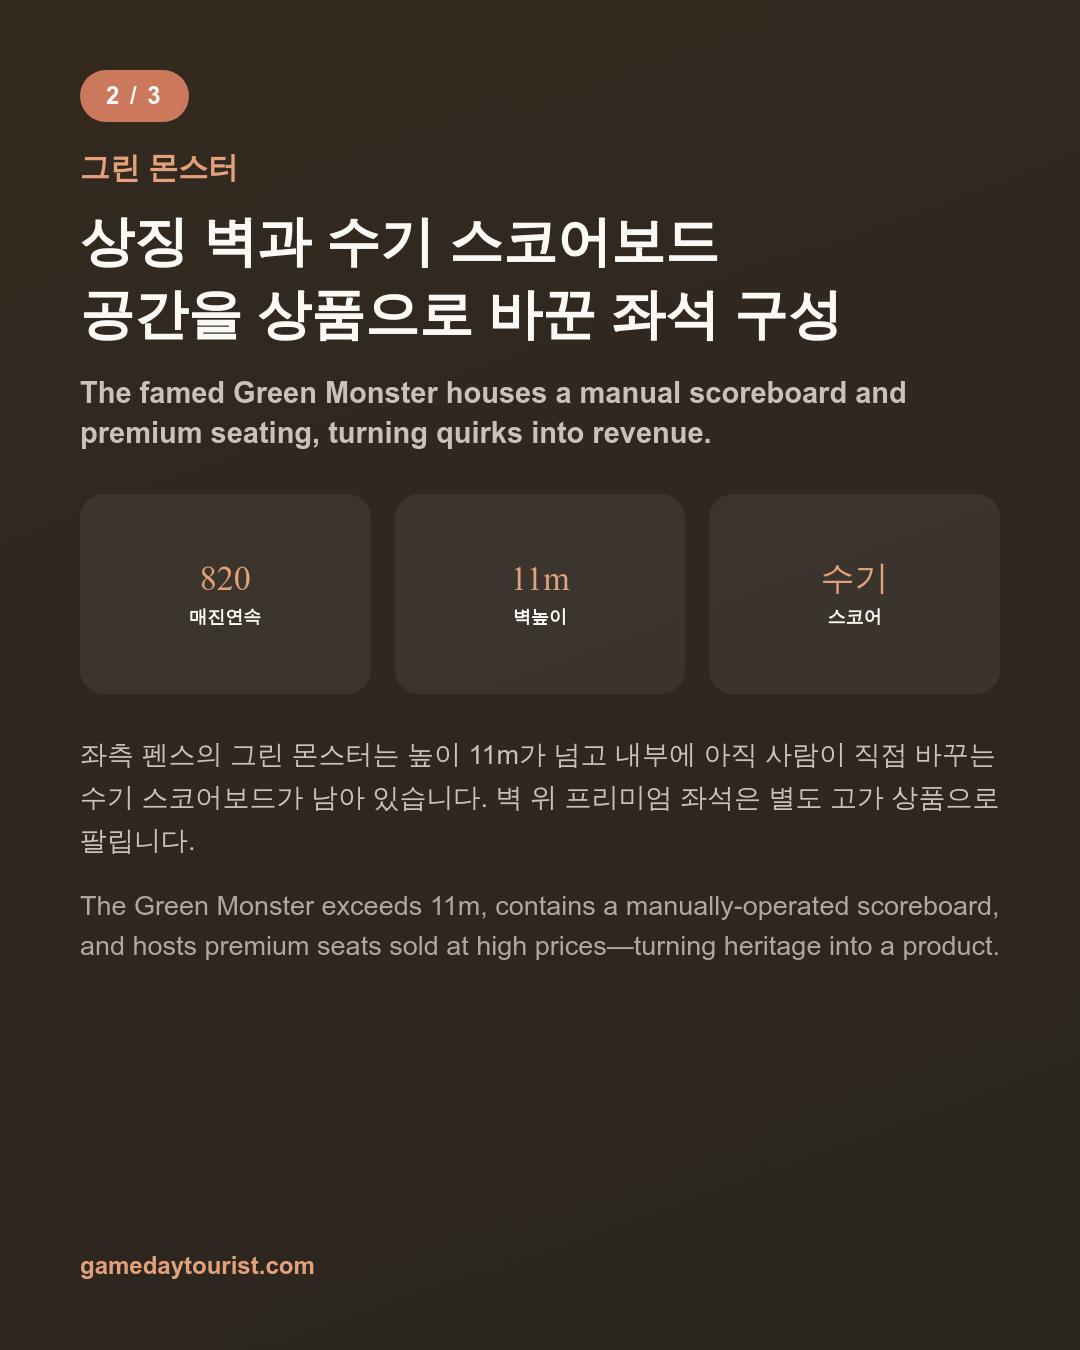
Fenway’s most iconic feature is its left-field wall, the Green Monster. Standing over 11 meters tall, it was originally built to compensate for the short left-field distance — and it’s since become the park’s single biggest asset.
Inside the wall sits the last hand-operated scoreboard left in MLB, still run by staff who physically swap the number plates from within. A small peephole on the outside lets visitors peek in, and it’s quietly become one of the most popular photo spots in the park.
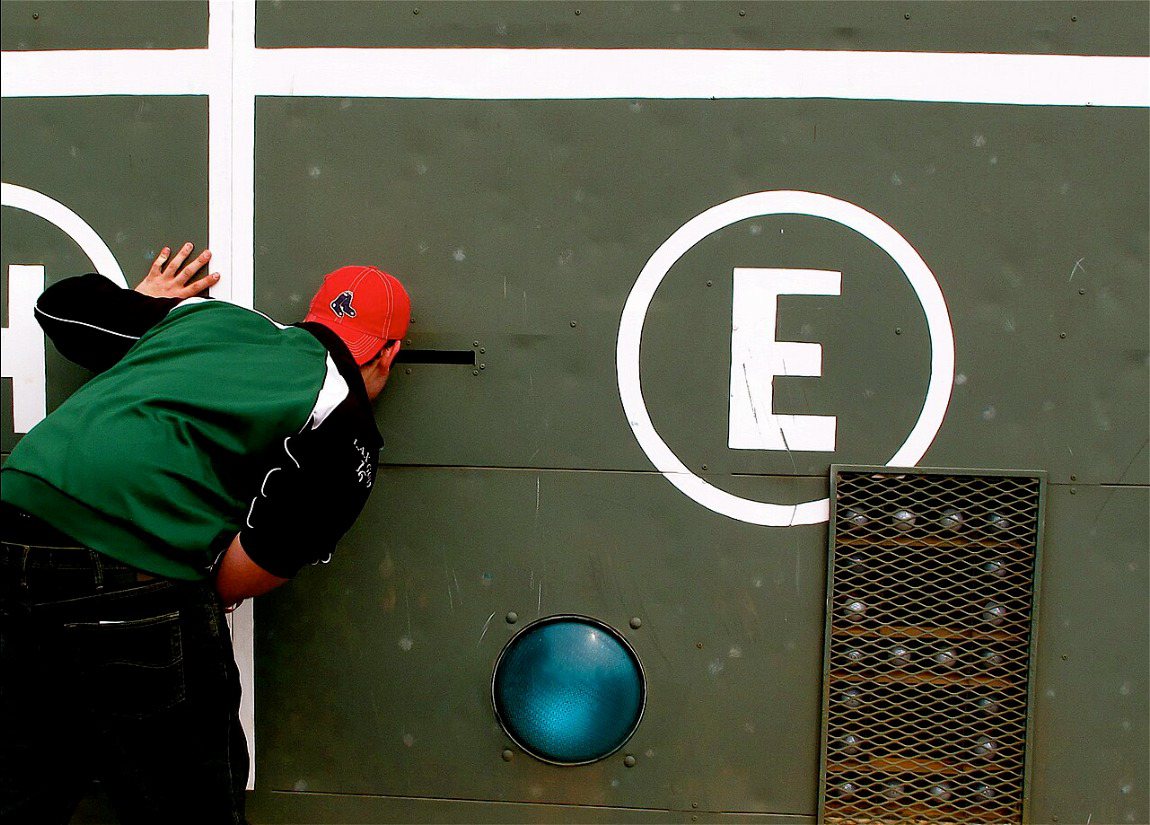
A visitor peering through a small gap in the Green Monster wall at the manual scoreboard inside · Source: Wikimedia Commons (photo by C.S. Imming), CC BY-SA 3.0
In 2003, a new tier of seating went in on top of the wall — barstool-style premium seats with a drink rail. According to ticket listings, individual seats run anywhere from $165 to as much as $700, while the “Ultimate Monster” private space for up to 27 guests sells for $27,000 to $35,000.
Those seats were one product of the roughly $285 million FSG spent over a decade renovating the park after buying the club in 2002.
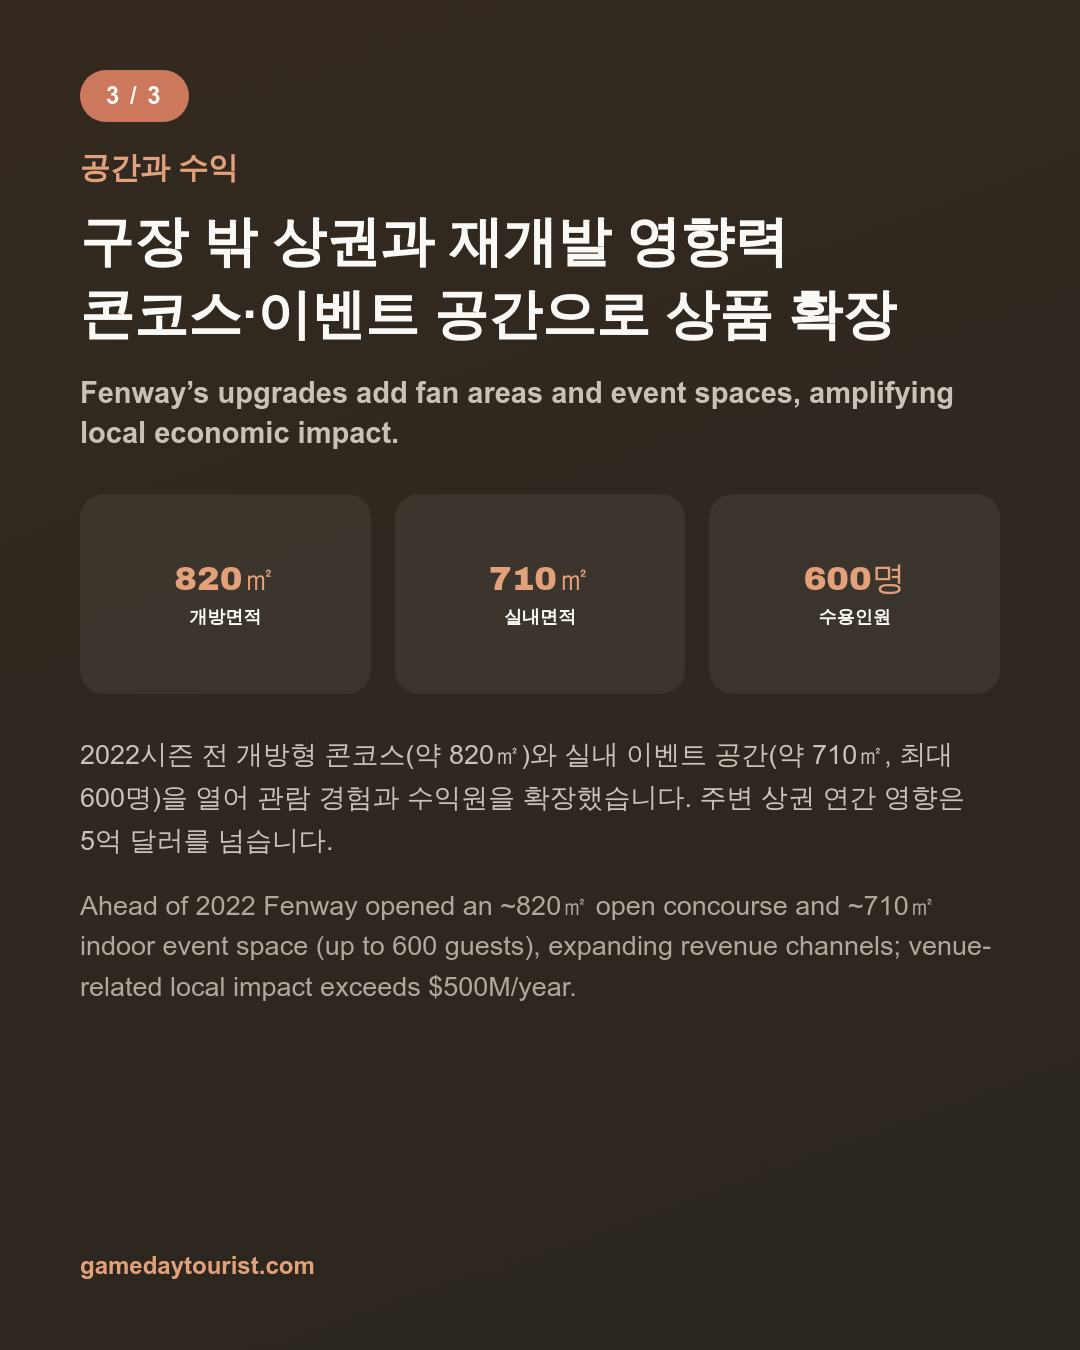
The investment in physical space has continued more recently, too. Ahead of the 2022 season, the club opened a roughly 820-square-meter open-air concourse behind the right-field bleachers, along with an indoor event space of about 710 square meters that can hold up to 600 guests.
Digging through fan accounts written in Korean, I found one review describing a one-hour stadium tour that covers the Green Monster, the visiting team’s clubhouse, the broadcast booth, and the museum, with a guide clearly well-versed in the club’s history.
Another review described the whole park as “a cultural landmark and a baseball shrine” — while also noting that the seats are a cramped 15 inches wide and the concourse is broken up into disconnected sections.
Even the park’s inconveniences seem to get consumed as part of its history. From a marketer’s standpoint, it’s the exact opposite strategy of competing on modern amenities.
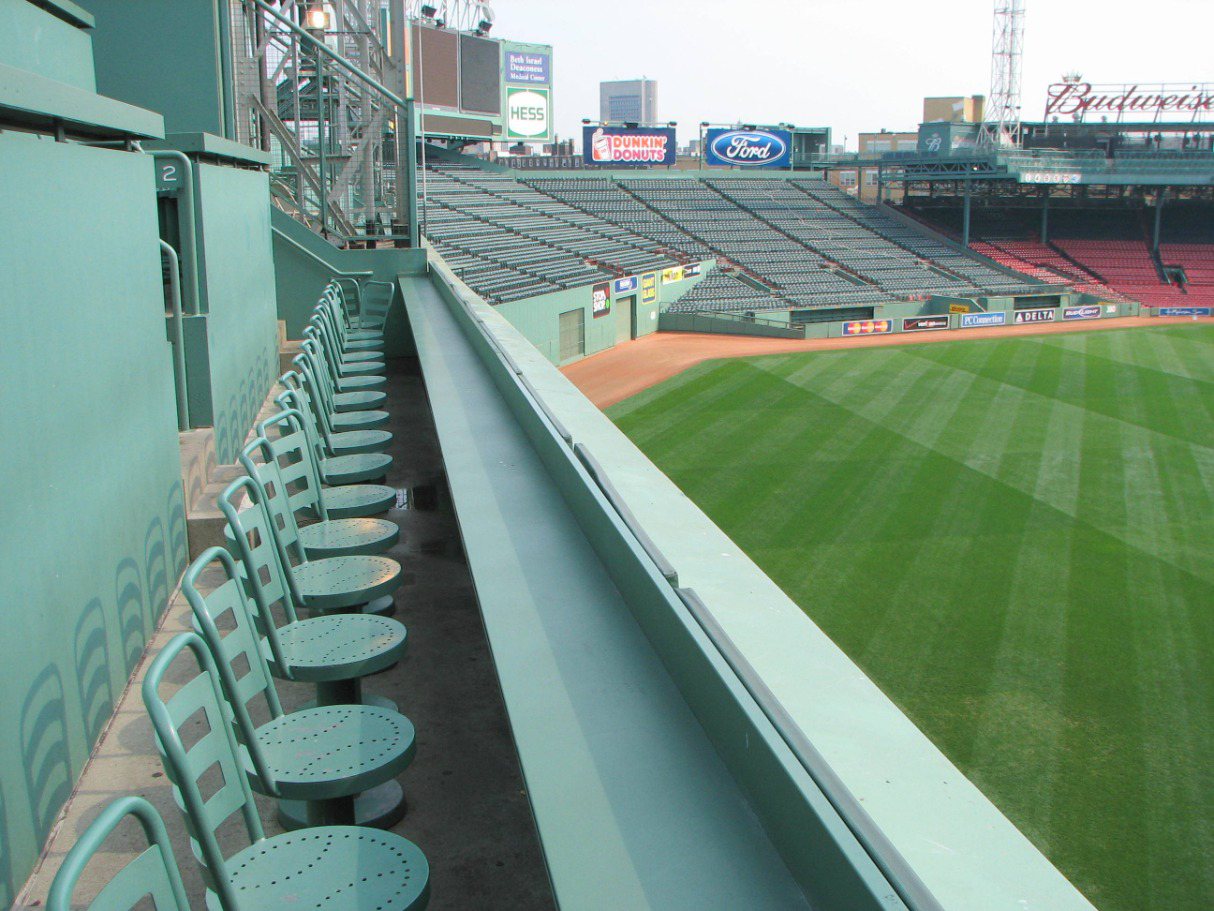
View of the outfield and stands from the premium seating atop the Green Monster · Source: Wikimedia Commons (photo by Bernard Gagnon), CC BY-SA 3.0
Ad Inventory and Broadcast Rights
For the jersey sleeve patch, the Red Sox signed a 10-year deal with MassMutual running from 2023 through 2032. Reported at $17 million a year, rising to $20 million with performance incentives, for a total of $170–200 million, it was the highest-value jersey patch sponsorship in MLB at the time it was signed.
The outfield walls are just as tightly packed with board ads from brands like Hess, Dunkin’, and Ford — even inside a small park, the ad inventory is squeezed in wherever it fits.
Broadcast rights sit with the club’s own regional network, NESN (New England Sports Network). FSG holds 80% of it, with the remaining 20% owned by Delaware North, which also owns the Boston Bruins and TD Garden — and NESN will air 145 games in the 2026 season.
When I looked at Liverpool, what stood out was that Anfield refuses to sell naming rights at all. Here, the strategy runs in the opposite direction — the club built its own broadcaster to pull broadcast revenue directly into its ownership structure.
Merchandise and Regional Economic Impact
Yawkey Way in front of the park closes to traffic on game days and effectively becomes an outdoor concourse of its own. It’s lined with souvenir shops alongside the Red Sox’s official team store, and figures from a local business association put the annual economic impact of park-related spending (beyond ticket sales, including concessions and merchandise) in the Fenway-Kenmore district at over $500 million.
The area is now slated for redevelopment under a plan called Fenway Corners, which will add more than 200 housing units and about 40 commercial spaces.
The low-rise souvenir shops of today will reportedly give way to a 16-story building, with a new team store planned for the ground floor. A single ballpark is shaping the redevelopment direction of an entire neighborhood.
The club’s valuation reflects that same revenue engine. In 2026 estimates from Forbes and Sportico, the Red Sox were valued at $5.0–5.25 billion, ranking third in MLB behind the Yankees and Dodgers.
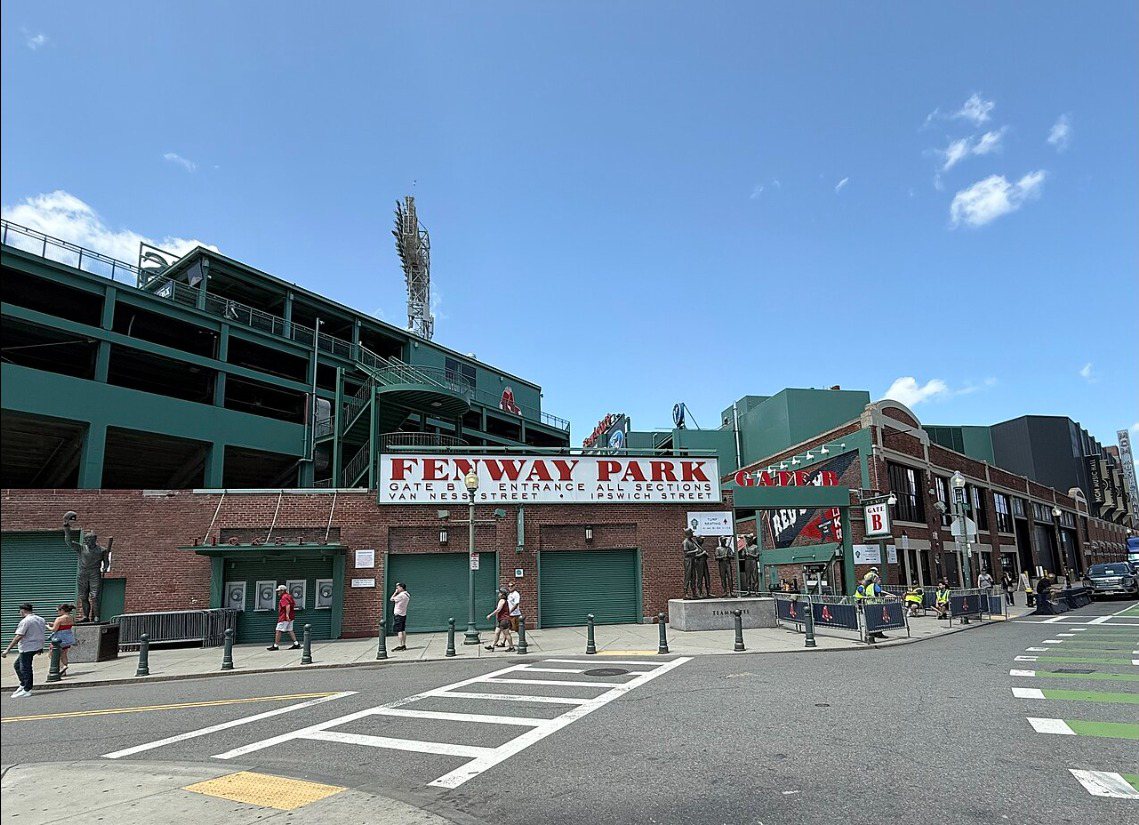
Exterior of Fenway Park’s Gate B entrance · Source: Wikimedia Commons (photo by Farragutful, 2025), CC BY-SA 4.0
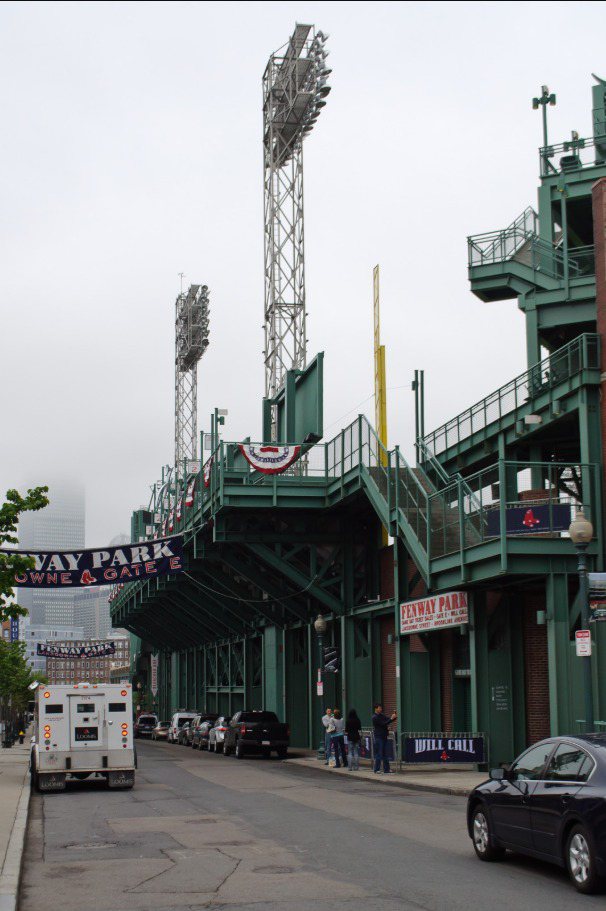
Street view near Fenway Park’s Gate E and Will Call area · Source: Wikimedia Commons (InSapphoWeTrust, Flickr), CC BY-SA 2.0
How This Compares to the KBO and K League
Domestic ballparks here tend to assume that newer facilities draw bigger crowds, so wider seats and better amenities usually top the marketing pitch. Fenway does the opposite.
It turns its biggest weakness — being the smallest, oldest park in the league — into scarcity, and builds its ticket premium on sellout records and history.
It’s a lot like the Koshien Stadium piece on the Hanshin Tigers I posted back on August 7. This only works with a century-plus of accumulated history behind it, so it’s not a strategy Korean ballparks can simply copy — but the idea of treating an aging stadium’s history as a product, rather than automatically as a teardown candidate, felt like something worth thinking about.
Broadcast rights offer a different kind of lesson. The KBO negotiates new-media and broadcast rights as a single league-wide contract, while the Red Sox’s own ownership group holds an equity stake in its regional network.
That model doesn’t translate directly to the KBO — the U.S. runs on regionally exclusive broadcast markets, while Korea operates as a single national market, so the underlying assumptions are different. Still, it’s a useful reference point for thinking about how much a club can realistically own of its own content-distribution pipeline.
Leave a Reply